In March 2001, Nova Scotia's provincial government released its energy strategy document entitled "Powering Nova Scotia's Economy". The document is intended to be a "public discussion paper on the province's energy strategy." The document is the product of the province's Petroleum Directorate and the Department of Natural Resources (PDF Copies of "Powering Nova Scotia's Economy" can be obtained from the Nova Scotia government's website: http://www.gov.ns.ca/petro/EnergyStrategy/).
Since any public discussion document is only as good as the information that it presents to the public, the information (that is, any data and associated claims) presented in the document is examined in this report. Four sections of the document are examined:
The units of energy used in both the energy strategy document and this report are petajoules (abbreviation 'PJ') or joules. A petajoule is equivalent to about 29 million litres of gasoline; enough energy to drive about 14,000 cars for one year [1].
This section of the document (pages iv through vii) contains a description of what is claimed to be Nova Scotia's present energy consumption patterns, both in terms of primary energy demand and end-use energy demand. It touches briefly on projected energy demand, based upon NRCan data, to 2010.
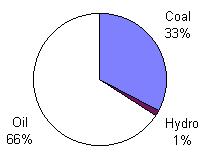
The province's primary energy demand for 1999, according to the energy strategy document, is shown in the following chart:
The province consumed some 269.4 PJ of energy from oil (177.1 PJ), coal (88.4 PJ) and hydro-electric/tidal (3.8 PJ). On page iv, the document states that "the absence of any specific information on wood use in the province creates a gap in the Nova Scotia data on energy use."
The above chart and the claim made with respect to the lack of data on wood use are both incorrect. According to NRCan's 1997 energy demand data for Nova Scotia (the last year of 'actual' data from NRCan), the province's primary energy demand of 262.1 PJ was met from oil (153.7 PJ), coal (87.5 PJ), renewables (23.1 PJ), and hydro/tidal (3.5 PJ) [2]. The 1997 data from NRCan is shown in the following chart:
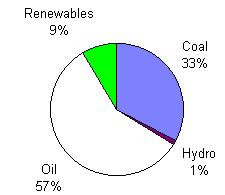
Contrary to what is stated in the energy strategy document, the province does use renewable energy (in the form of wood waste and pulp spenting) to satisfy its primary energy demand.
What is even more disturbing is the suggestion that in 1999, oil accounted for 66 percent of the province's primary energy demand, while in 1997 it was only 57 percent. There was not a 9 percent growth in oil consumption in the province between 1997 and 1999 (as shown in [3]). The energy strategy document combines the provincial renewable energy demand with the oil demand to create the impression that oil satisified a larger share of the province's primary energy demand.
This manipulation of the data is not restricted to Nova Scotia's primary energy demand data. The following chart from the energy strategy document claims to be the province's end-use energy demand by sector:
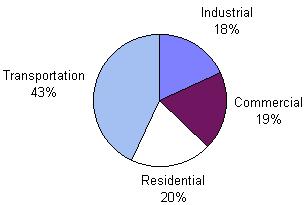
The end-use in the above chart suggests a roughly equal split between industrial, commercial, and residential energy end-use of about 20 percent each, with transportation making up the remainder. However, using NRCan's actual 1997 data, one finds a significantly different breakdown in the province's end-use energy demand:
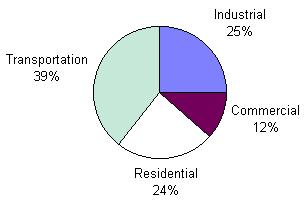
NRCan's actual data for end-use energy demand for the province shows industrial and residential energy usage to be considerably higher. The reason for the discrepancy between the data in the energy strategy document and the NRCan data can be explained by the omission of renewable energy. The NRCan end-use data for 1997 is listed in an appendix at the end of this report.
The authors of the document were presumably aware of the role of renewables in the province. For example, on page xxvi, the document describes the Brooklyn Energy Centre, a "22 MW co-generation plant fueled by wood waste". In the same paragraph, the document discusses sawmills that use sawdust-fired kilns, biomass heating of greenhouses, manufacturing facilities, hospitals, and schools. It also states that the residential use of wood fuel is expected to rise in 2001 because of increased world oil prices.
This section of the energy strategy document also discusses electrical generation in the province. As with the primary energy and end-use demands, the information on electrical generation is questionable:
| Source | Document | NRCan |
|---|---|---|
| Coal | 8,200 | 8,228 |
| Oil | 800 | 1,007 |
| Hydro/Tidal | 900 | 959 |
| Imports | 300 | 185 |
| Exports | N.A. | 345 |
| Biomass/Wind | N.A. | 320 |
| Total | 10,200 | 10,354 |
This section (pages viii though xiii) examines recent prices for a number of energy commodities, notably petroleum products (gasoline, home heating oil), electricity (residential, time-of-use, industrial, and commercial), and natural gas (based upon Sempra's projections). With the exception of electricity, all data is 'historical' and covers 1999 and 2000 (electrical data is for 1995/96 to 2000). The document does not consider long term energy prices, nor does it discuss disposable income.
The following chart shows the real (1990 to 1997) and projected (2000 to 2020) growths in household disposable income for Nova Scotia, and residential and transportation fuel prices for Atlantic Canada [2]:
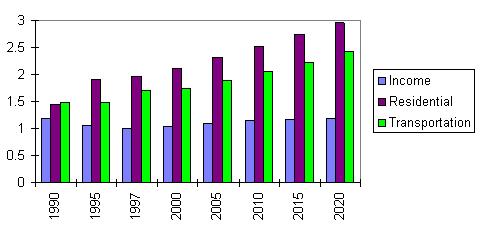
Although household disposable incomes are projected to rise by 14% (2010) and 17.6% (2020), residential energy prices increase by 27.9% (2010) and 50.8% (2020). Similarly, the energy costs associated with transportation are projected to rise by 23.8% (2010) and 44.6% (2020). In short, energy prices are expected to rise at much faster rates than disposable income.
This section (pages xiv through xvi) discusses Nova Scotia's past ventures in the field of oil and gas and its present and future activities. According to the document, the proven reserves have increased from 3.5 to 6.3 trillion cubic feet, the total potential reserves have been estimated to be 20 trillion cubic feet. The document also states that some investment analysts project potential reserves of anywhere from 40 to 50 trillion cubic feet (based upon deep-water areas beyond Sable Island).
Using numbers such as those listed above, many people, including Premier Hamm are touting Nova Scotia as a "world-class player in the energy industry" and that Halifax is "North America's newest energy capital" (see Foreward on page 3 of document). Despite these claims, it is worth putting Nova Scotia's natural gas potential into perspective:
This section (pages xlix through l) discusses the employment benefits to be gained from the oil and gas sector. It suggests "based upon experience in other markets", the oil and gas industry could employ between 12,000 and 18,000. This prediction overlooks a number of important issues:
In conclusion, it is the author's belief that the entire provincial energy strategy is flawed. What the province needs is an energy policy to address issues such as transportation, climate change, renewable energy, sustainable energy, conservation, the role of independent power producers, and energy efficient practices. Instead, what is being presented as an energy "strategy" is a plan for promoting the province's limited oil and gas resources.
The following NRCan data is for the different sectors of the Nova Scotia economy. The 1997 data is actual, while 2000 is projected; all values are in petajoules (PJ).
| RESIDENTIAL | 1997 | 2000 |
|---|---|---|
| Electricity | 13.2 | 13.4 |
| Natural gas | 0.0 | 0.0 |
| Oil products | 25.4 | 22.2 |
| Coal | 0.6 | 0.6 |
| LPGs | 0.7 | 0.3 |
| Wood | 8.1 | 9.1 |
| Total | 48 | 45.6 |
| COMMERCIAL | 1997 | 2000 |
|---|---|---|
| Electricity | 10.4 | 11.2 |
| Natural gas | 0.0 | 0.0 |
| Oil products | 11.4 | 10.1 |
| LPGs | 1.8 | 0.8 |
| Total | 23.5 | 22.1 |
| INDUSTRIAL | 1997 | 2000 |
|---|---|---|
| Electricity | 10 | 12 |
| Natural gas | 0 | 0 |
| Oil products | 26.9 | 26.3 |
| Coal | 0.8 | 1.0 |
| LPGs | 0.9 | 0.5 |
| Steam | 0.0 | 0.0 |
| Coke/Coke oven gas | 0.1 | 0.0 |
| Pulp/Wood waste | 10.1 | 12.5 |
| Total | 50.8 | 52.5 |
| TRANSPORTATION | 1997 | 2000 |
|---|---|---|
| Oil products | 80.0 | 83.8 |
For futher information on this report, please contact larry.hughes@dal.ca
Last updated: 26 April 2001